
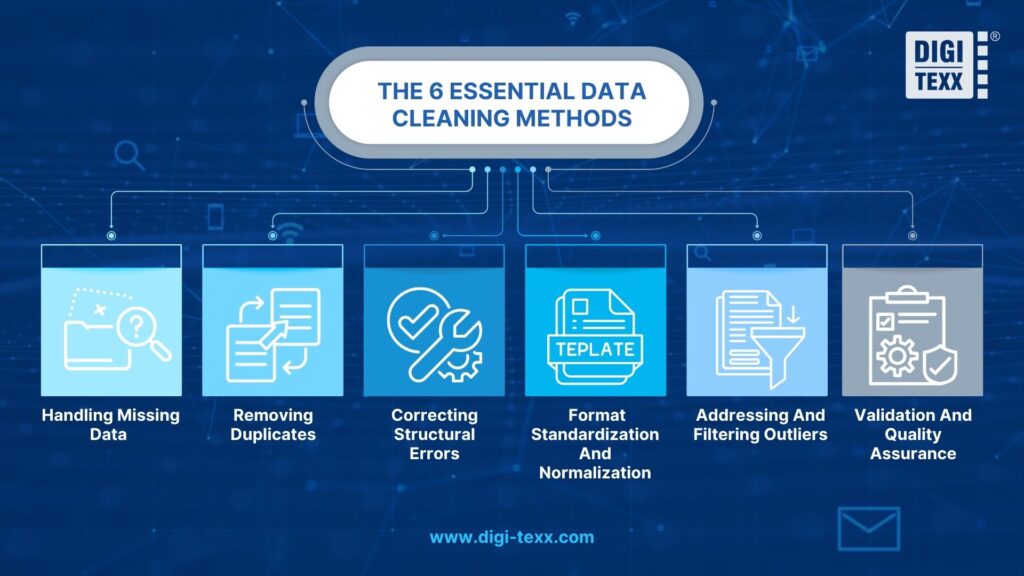
Data cleaning methods are systematic techniques used to identify and correct corrupt, duplicate, or incomplete records in a raw dataset, a crucial step, especially when dealing with the differences between structured and unstructured data. The six core methods include handling missing data, removing duplicates, correcting structural errors, format standardization, filtering outliers, and data validation (QA).
At DIGI-TEXX, applying these methods within our intelligent document processing services ensures clean input data, which enhances the accuracy of AI models and analytics reports.
What Is Data Cleaning?
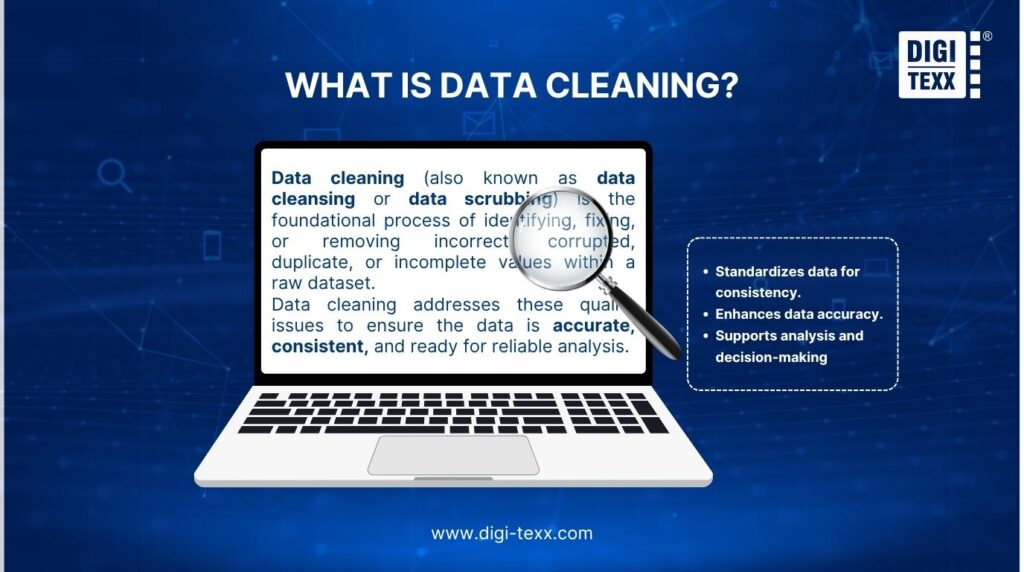
Data cleaning (also known as data cleansing or data scrubbing) is the foundational process of identifying, fixing, or removing incorrect, corrupted, duplicate, or incomplete values within a raw dataset. When combining multiple data sources, records can easily become mislabeled or duplicated. Data cleaning addresses these quality issues to ensure the data is accurate, consistent, and ready for reliable analysis.
In practical terms, “clean” data does not necessarily mean perfect data. Instead, it means the dataset is fit for your specific use case: required fields are handled with a clear policy, data types are standardized, and obvious contradictions are flagged. Establishing a standard data cleaning template is a core component of effective data management, which is crucial for powering modern artificial intelligence (AI) and comprehensive business process automation solutions.
While often used together during data preparation, it is important to distinguish data cleaning from data transformation, as they serve distinct functions in the data pipeline:
- Data Cleaning focuses on removing or correcting data that does not belong in your dataset (e.g., fixing syntax errors or handling missing values).
- Data Transformation (also referred to as data wrangling or data munging) is the process of converting and mapping data from one “raw” format or structure into another format suitable for data warehousing and analyzing.
In short, data cleaning eliminates the errors within your dataset, whereas data transformation reshapes that cleaned data for its final analytical destination.
>>> See more:
- Intelligent Document Recognition (IDR): Definition, Example, Benefits
- Best Insurance Claims Processing Outsourcing BPO in the US 2026
- Construction Invoice Reconciliation: Process, Best Practices & Software 2026
Why Is Data Cleaning Important?
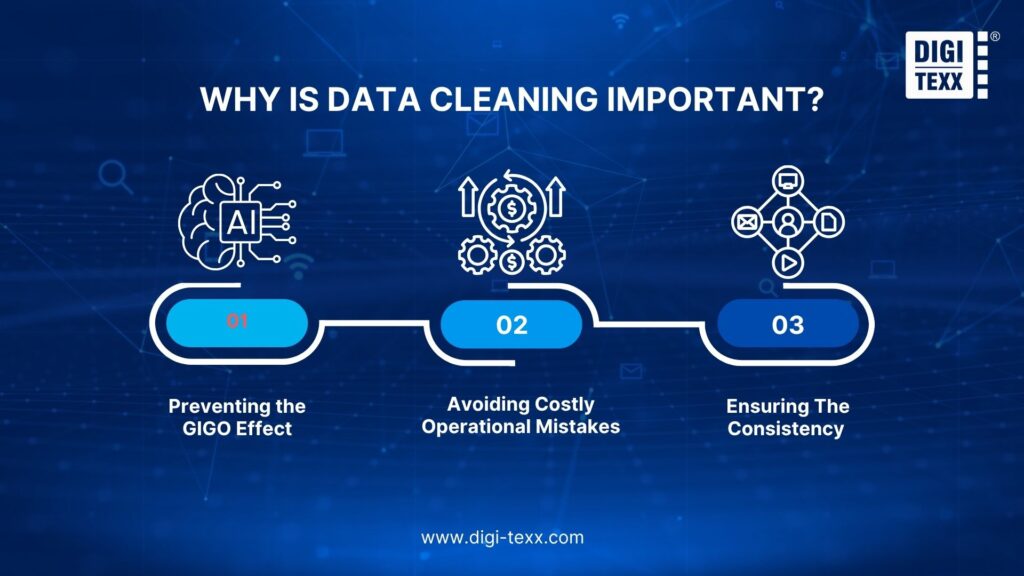
Data cleaning is not just a preliminary IT task; it is the foundation of reliable decision-making and modern enterprise success. High-quality data is the lifeblood of business intelligence and machine learning systems. Ignoring this process leads to the GIGO (Garbage In, Garbage Out) effect, where no amount of advanced analytics can fix data that is fundamentally flawed.
Raw data collected from various sources is often riddled with structural errors and duplicates. Messy data fails quietly by distorting results in ways that are hard to spot. For example:
- Wrong KPIs: Duplicated rows artificially inflate revenue or user counts.
- Broken Segmentation: Inconsistent category labels split the same customer group.
- Misleading Averages: Outliers pull metrics in unrealistic directions.
Poor data quality leads to costly errors, such as overstocking inventory due to duplicate records or misinterpreting customer behavior. Therefore, data cleaning is a core strategy that determines whether your insights reflect reality or noise.
“Poor data quality costs organizations at least $12.9 million a year on average” – Gartner
Key Benefits Of Implementing Data Cleaning
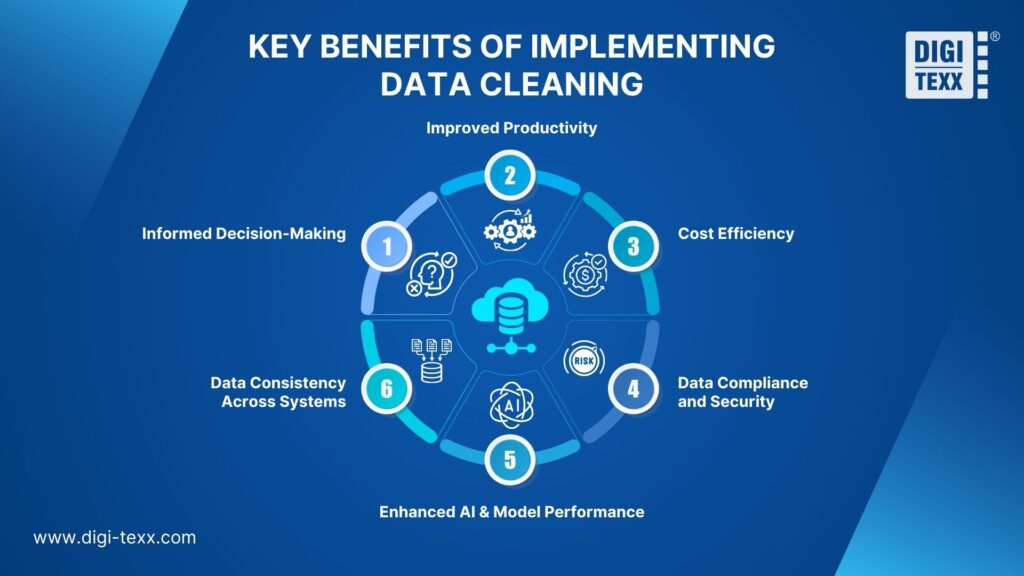
Having clean data will ultimately increase overall productivity and allow for the highest quality information in your decision-making. By establishing a rigorous data cleaning process, organizations can unlock the following strategic advantages:
- Informed Decision-Making: Decisions based on clean, high-quality data are highly effective and directly aligned with business goals. It eliminates strategic missteps and wasted resources caused by typos or inconsistencies.
- Improved Productivity: Clean data enables teams to spend less time fixing errors and more time focusing on high-value data analysis. Fewer bottlenecks create smoother workflows, leading to happier clients and less-frustrated employees.
- Cost Efficiency: Data cleaning prevents costly operational errors and reduces financial risks. Better error monitoring makes it easier to fix corrupt data at the source, saving future operational costs.
- Data Compliance and Security: Keeping data accurate and current helps organizations comply with strict regulations like GDPR. It actively prevents the accidental retention of sensitive or redundant information, minimizing data security risks.
- Enhanced AI & Model Performance: Data cleaning is an essential prerequisite for training effective machine learning models. It improves output accuracy and ensures algorithms generate robust, unbiased predictions. For instance, flawlessly cleaned and preprocessed datasets are the foundational requirement that drives the success of complex computer vision projects, such as vehicle annotation to enhance traffic monitoring and AI-powered security system.
- Data Consistency Across Systems: Clean data ensures that information combined from multiple sources remains consistent and usable. This standardization allows disparate business intelligence systems to communicate and share data seamlessly.
>>> See more:
- Top Business Process Documentation Tools You Should Consider
- Medical Claims Processing Outsourcing Services For Faster Reimbursements
- Prepare A Classified Balance Sheet: Steps, Format & Example 2026
The 6 Essential Data Cleaning Methods: A Step-by-Step Guide
The standard data cleaning process involves six sequential methods: handling missing data, removing duplicates, correcting structural errors, standardizing formats, filtering outliers, and executing data validation. Mastering these techniques ensures your dataset is accurate, consistent, and fully optimized for business intelligence or machine learning models.
- Step 1: Handling Missing Data
- Step 2: Removing Duplicates
- Step 3: Correcting Structural Errors
- Step 4: Format Standardization
- Step 5: Filtering Outliers
- Step 6: Data Validation (QA)
| Method | Primary Objective | Best Tool / Function | When to Apply |
| Missing Data | Fill or delete null values | Pandas (fillna(), dropna()) | When nulls skew analytics |
| Duplicates | Eliminate redundant rows | Excel (Remove Duplicates) | When merging databases |
| Structural Errors | Fix typos & whitespaces | Excel (TRIM()) / Python | After manual data entry |
| Standardization | Unify formats (dates, text) | Excel (Find & Replace) | When conventions differ |
| Outliers | Handle extreme data points | Python (IQR, Z-Score) | When analyzing variance |
| Validation (QA) | Verify logical rules | SQL (CHECK), Excel Validation | Final pipeline checkpoint |
1. Handling Missing Data
Handling missing data is the process of identifying and resolving null or blank fields within a dataset. Unaddressed missing values cause analytical algorithms to fail or produce skewed predictions. Common resolutions include deleting incomplete rows or intelligently imputing values based on statistical patterns.
When To Use:
Apply this method immediately upon importing raw data, especially when missing values constitute a significant portion of the dataset and simply dropping rows would destroy statistical integrity.
How To Implement (Practical Steps):
- In Python (Pandas): Use the df.fillna() function to replace NaN values with a scalar (like the column mean) or df.dropna() to remove rows with any missing data.
- Predictive Imputation: For complex datasets, utilize Scikit-learn’s K-Nearest Neighbors (KNN) imputer to infer missing values based on the similarity of neighboring data points.
Example:
| Raw Data (Before) | Applied Action | Clean Data (After) |
| Age: 25 | None | Age: 25 |
| Age: NaN (Null) | Imputation (Column Mean: 28) | Age: 28 |
| Age: NaN (Null) | Deletion (Row Dropped) | (Record Removed) |
2. Removing Duplicates (Data Deduplication)
Removing duplicates is the process of finding and eliminating identical or partially matching records within a dataset. Data deduplication prevents inflated metrics, such as counting a single customer multiple times and optimizes storage capacity, ensuring reports accurately reflect real-world figures.
When To Use:
Implement this method when merging multiple databases (e.g., CRM and email marketing lists) where the same user might have been entered multiple times under slightly different conditions.
How To Implement (Practical Steps):
- In Excel/Google Sheets: Select your data range and navigate to the Data tab, then click Remove Duplicates. Excel allows you to select specific columns (keys) to determine what constitutes a duplicate; identical values are permanently deleted while keeping the first occurrence.
- In Python (Pandas): Use the df.drop_duplicates(subset=[‘column_name’], keep=’first’) method to remove duplicate rows based on specific columns while retaining the first occurrence.
Example:
| Raw Data (Before) | Applied Action | Clean Data (After) |
| ID: 101, Email: [email protected] | Keep First Occurrence | ID: 101, Email: [email protected] |
| ID: 101, Email: [email protected] | Duplicate Removed | (Record Deleted) |
| ID: 102, Email: [email protected] | Unique Record | ID: 102, Email: [email protected] |
3. Correcting Structural Errors
Correcting structural errors involves fixing typos, removing irregular whitespaces, and standardizing inconsistent naming conventions (like “N/A” vs. “Null”). These anomalies usually occur during manual data entry, system migrations, or OCR extractions, directly threatening data grouping accuracy.
When To Use:
Use this method when categorical data fails to aggregate correctly in pivot tables, BI tools, or SQL queries due to trailing spaces, hidden characters, or mismatched capitalization.
How To Implement (Practical Steps):
- In Excel: Use the =TRIM() function to automatically remove extra leading and trailing spaces from text strings.
- In Python (Pandas): Apply df[‘column’].str.strip() to eliminate whitespaces, and use the df.replace() function to consolidate varying “Not Applicable” labels into a single pd.NA value for consistency.
Example:
| Raw Data (Before) | Applied Action | Clean Data (After) |
| Apple Inc. | TRIM() (Whitespace removed) | Apple Inc. |
| N/A | Consolidated to standard label | Not Applicable |
| Null | Consolidated to standard label | Not Applicable |
4. Format Standardization And Normalization
Format Standardization is the systematic process of converting diverse data inputs, such as dates, currencies, and text casing into a single, unified structure. This method ensures all data points follow a consistent rule, allowing analytical systems to aggregate and query information without breaking.
When To Use:
Apply this method when combining raw datasets from multiple sources (e.g., merging CRM data with external marketing reports) where standard conventions differ, such as varying date formats (MM/DD/YYYY vs. DD/MM/YYYY) or inconsistent capitalization.
How To Implement (Practical Steps):
Instead of manually generating new columns to format data, efficiency-driven workflows prioritize in-place standardization.
- In Excel/Google Sheets: Rather than creating an entirely new column to clean data, use the intrinsic Find & Replace (Ctrl+H) function to replace messy numerical values directly within the active cell (e.g., replacing ” USD” with nothing to convert to pure numbers). For text normalization, functions like =PROPER() or =UPPER() can be applied in an adjacent column before pasting the values back as plain text.
- In Python (Pandas): Use df[‘column_name’] = pd.to_datetime(df[‘column_name’], format=’%Y-%m-%d’) to enforce the ISO 8601 date standard directly across the entire dataset.
Example:
| Raw Data (Before) | Applied Action | Clean Data (After) |
| 1000 USD | Find ” USD” > Replace with “” | 1000.00 (Numeric) |
| $1,000 | Find “$” and “,” > Replace with “” | 1000.00 (Numeric) |
| 12/10/2026 | Date Conversion (ISO 8601) | 2026-10-12 (Date) |
5. Addressing And Filtering Outliers
Filtering outliers is the process of identifying extreme data points that deviate significantly from the rest of the distribution. Because outliers disproportionately skew statistical averages and machine learning models, they must be isolated and evaluated before being capped, transformed, or removed.
When To Use:
Apply this method when analyzing numerical variables with high variance (like salaries, housing prices, or website session durations) to prevent extreme values from distorting predictive models or baseline averages.
How To Implement (Practical Steps):
- Statistical Filtering (IQR Method): Calculate the Interquartile Range (IQR = Q3 – Q1). Define fences at Q1 – 1.5 * IQR and Q3 + 1.5 * IQR. Any data point falling outside these bounds is mathematically flagged as an outlier.
- Z-Score Method: Calculate the Z-score for your data to measure how many standard deviations a point lies from the mean. Typically, values with an absolute Z-score greater than 3 are considered extreme outliers and can be filtered using libraries like Scikit-learn or SciPy.
Example:
| Raw Data (Before) | Applied Action | Clean Data (After) |
| Salary: $50,000 | Within Normal Range | Salary: $50,000 |
| Salary: $55,000 | Within Normal Range | Salary: $55,000 |
| Salary: $9,000,000 | Outlier Capped at Upper Bound | Salary: $120,000 |
6. Validation And Quality Assurance (QA)
Data validation is the final quality assurance step that applies strict logical rules and constraints to verify dataset accuracy. It ensures referential integrity, format compliance, and logical consistency before the data enters production environments or business intelligence dashboards.
When To Use:
Implement QA protocols continuously at the data ingestion layer and as the final sign-off step in your data pipeline to prevent the “Garbage In, Garbage Out” (GIGO) effect.
How To Implement (Practical Steps):
- In Excel: Navigate to Data > Data Validation to restrict cell inputs to specific formats (like a predefined drop-down list or dates within a specific range), proactively preventing structural errors at the source.
- Logical Constraints (SQL): Enforce referential integrity by utilizing FOREIGN KEY constraints or adding CHECK constraints (e.g., CHECK (end_date >= start_date)) directly within your relational database schema.
Example:
| Data Entry Attempt (Before) | Constraint Rule Applied | Outcome (After) |
| Start: 2026-05-01 | Date format check | Accepted |
| Phone: 123 | Must contain 10 digits | Rejected (Error Prompt) |
| End: 2026-04-01 | End Date >= Start Date | Rejected (Logic Failed) |
>>> See more:
- Top 11 Free AI Business Document Analysis Tools 2026
- Best Administrative Support Outsourcing Services In 2026
- AI In Investing: What Every Investor Needs To Know
Choosing The Right Tools For Your Data Preprocessing Workflow
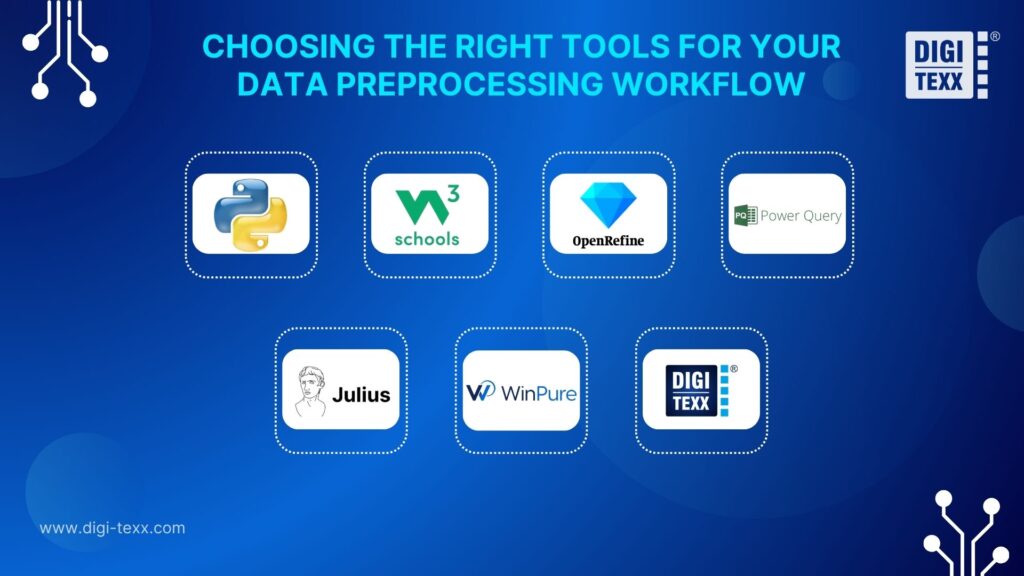
Data cleansing tools identify and remove errors to ensure high data quality. The best choice depends entirely on your technical skills and dataset size. Non-coders typically rely on visual software or AI platforms, data professionals leverage programming libraries (Python, SQL), while enterprises dealing with massive datasets scale securely using specialized BPO services.
Top Data Cleaning Tools Comparison:
| Tool / Platform | Best For | Key Advantages | Limitations |
| Python (Pandas) & SQL | Data Scientists, Engineers | Industry standard. Highly flexible for complex logic, filtering outliers, and database-level formatting. | Requires advanced programming skills. |
| OpenRefine | Analysts, SMEs | Code-free, open-source app with powerful “clustering” to group and merge messy text entries. | RAM limited; unsuitable for massive datasets. |
| Microsoft Power Query | Business Users | Built directly into Excel and Power BI with a visual interface for quick data transformations. | Performance drops on extremely large files. |
| Julius AI & WinPure | Non-coders, CRM Managers | Rapid AI-prompted cleaning (Julius) and advanced fuzzy deduplication (WinPure). | Commercial licensing costs; limited custom code logic. |
| BPO Services (DIGI-TEXX) | Enterprises, AI Startups | Extremely fast Big Data processing, ISO 27001 security, and hybrid AI + Human 99.9% QA. | Requires an initial deployment budget. |
Implementing Large-Scale Data Cleaning Methods With DIGI-TEXX
Maintaining an in-house data cleaning team harbors massive hidden financial losses, forcing senior data scientists to spend 80% of their time fixing basic errors. DIGI-TEXX solves this bottleneck by providing secure, scalable data processing services that combine AI automation with expert human validation.
Paying premium salaries to engineers just to format spreadsheets or delete duplicate rows is a severe opportunity cost. Furthermore, self-managed data preparation often lacks strict security infrastructure, increasing the risk of leaking Personally Identifiable Information (PII). Do not let messy data and inefficient processes stall your enterprise growth and machine learning performance.
At DIGI-TEXX, we solve the Big Data challenge at scale through professional document processing services and Business Process Outsourcing (BPO) services. With our specialized Hybrid Pipeline (AI + Human-in-the-loop), our software rapidly automates 80% of routine data cleansing. Meanwhile, our team of experienced data specialists directly handles the remaining 20% of complex, domain-specific edge cases.
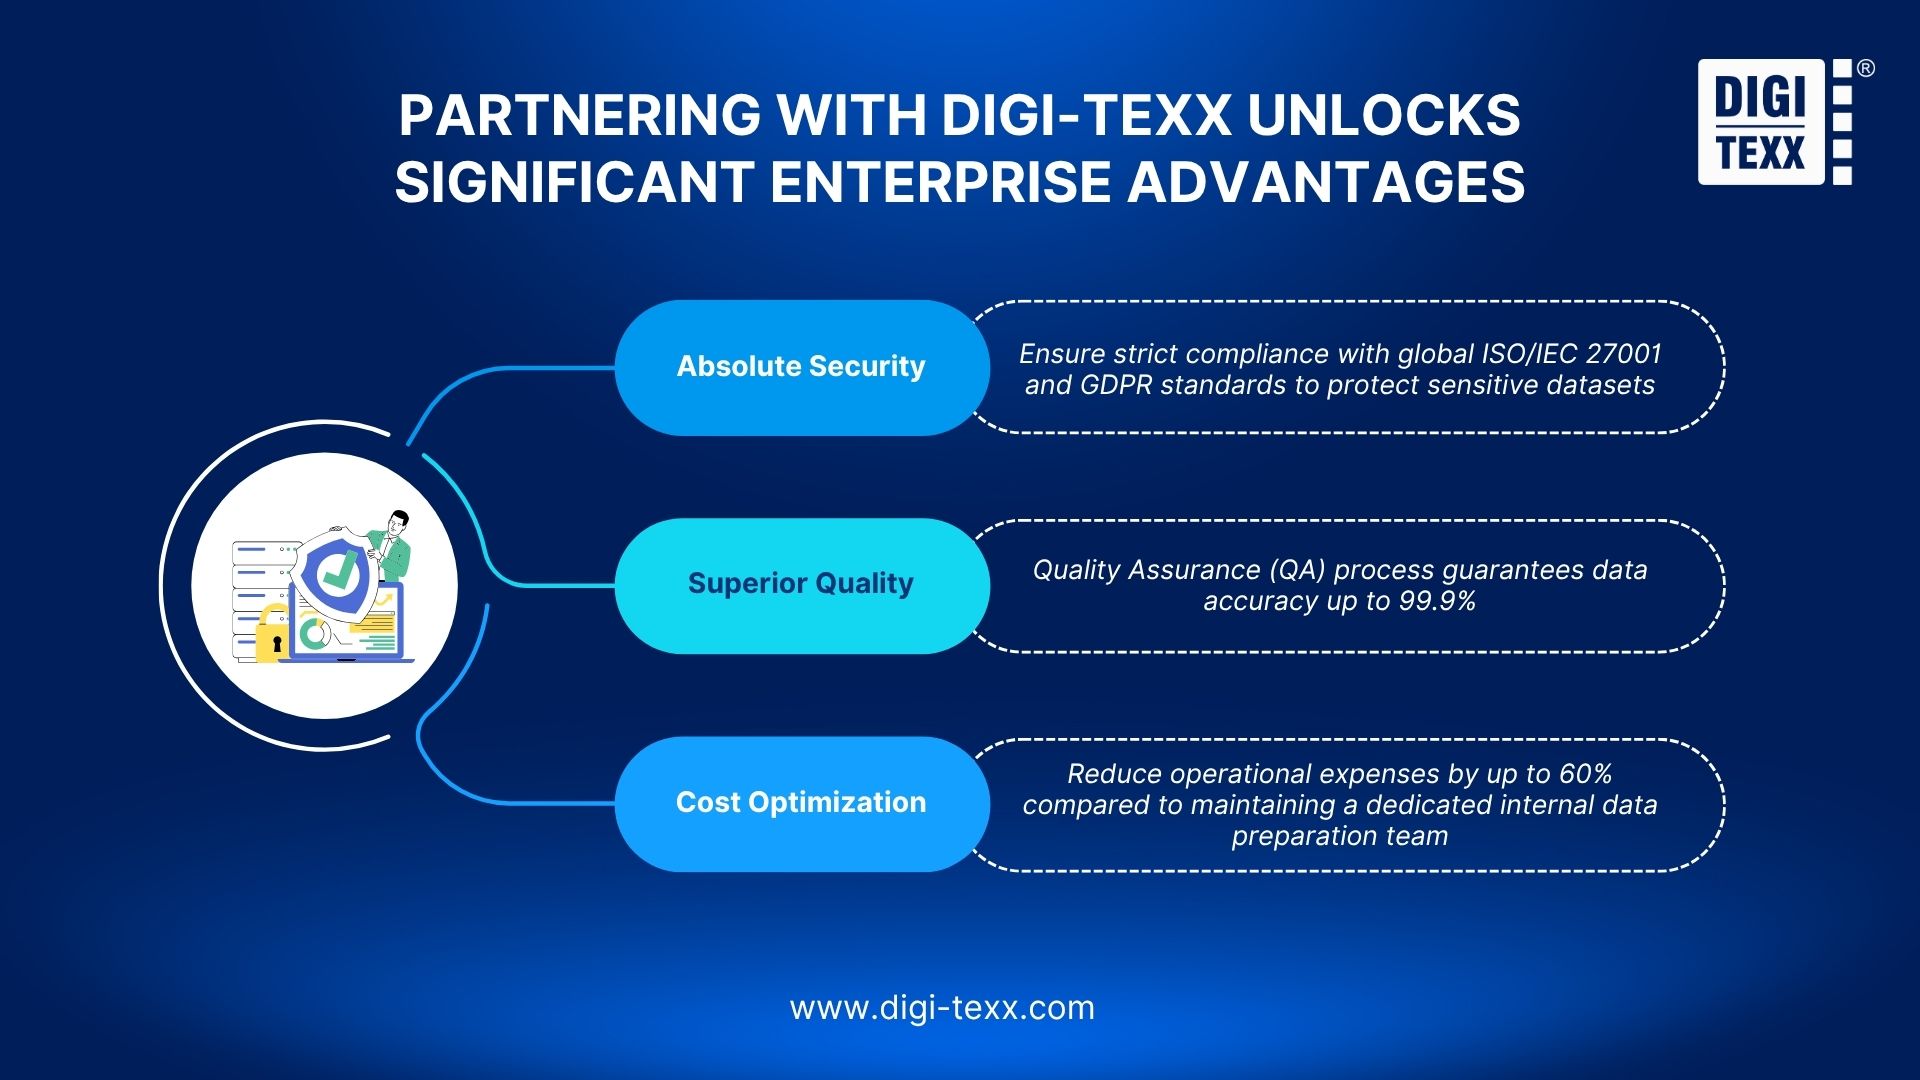
Partnering with DIGI-TEXX unlocks significant enterprise advantages:
- Absolute Security: We ensure strict compliance with global ISO/IEC 27001 and GDPR standards to protect your sensitive datasets at all times.
- Superior Quality: Our rigorous dual Quality Assurance (QA) process guarantees data accuracy up to 99.9%.
- Cost Optimization: Reduce your operational expenses by up to 60% compared to maintaining a dedicated internal data preparation team.
>>> See more:
- 15 Best Invoice Processing Software Compared In 2026
- Invoice Reconciliation Process: Step-By-Step Guide & Key Steps
- 25 Document Management Software & Platforms 2026
FAQs About Data Cleaning Methods
What Is The Difference Between Data Cleaning And Data Wrangling?
Data cleaning focuses strictly on correcting errors, removing duplicates, and filling missing values to remove “garbage.” Data wrangling, or data munging, is a broader process involving restructuring, merging tables, and transforming raw data formats into entirely new structures for specific analytical purposes.
What Are The 5 C’s Of Data Quality?
The 5 C’s of data quality are Clean, Consistent, Conformed, Current, and Comprehensive. These principles ensure that your dataset is free of errors, standardized across all systems, adheres to business rules, remains up-to-date, and contains all necessary information required for accurate AI and business intelligence analysis.
Can ChatGPT Do Data Cleaning?
Yes, ChatGPT and other LLMs can assist with data cleaning by generating Python or SQL scripts, writing regular expressions (Regex) to standardize formats, and identifying anomalies. However, ChatGPT cannot securely process massive enterprise datasets directly due to token limits and strict data privacy (PII) regulations.
Is SQL A Data Cleaning Tool?
Yes, SQL (Structured Query Language) is one of the most powerful data cleaning tools for relational databases. Data engineers use SQL queries to identify null values, standardize text cases, filter outliers, and execute complex deduplication processes directly at the data ingestion layer before analysis begins.
Can The Data Cleaning Process Be 100% Automated?
No, data cleaning cannot be entirely automated. While Python scripts or AI tools can automatically handle 80% of common errors like date formatting or deduplication, complex unstructured data and deep domain-specific anomalies still require a “Human-in-the-loop” approach. Human intervention remains mandatory to achieve 99.9% accuracy.
What Is The Best Method To Handle Outliers?
There is no single best method; it depends entirely on the business context. You should use statistical models like Box plots or Z-Scores to identify them. If the outlier is a typo, delete it. If it is a real anomaly, use mathematical transformations like Log-scaling instead of deletion.
Why Is Format Standardization Mandatory?
Without standardization, computer systems cannot accurately group or query data. For example, a database will treat “NYC,” “New York City,” and “New York” as three completely different entities. Standardization synchronizes categorical fields, units of measurement, and dates into a single unified format, ensuring analytics reports remain unbroken.
DIGI-TEXX Contact Information:
🌐 Website: https://digi-texx.com/
📞 Hotline: +84 28 3715 5325
✉️ Email: [email protected]
🏢 Address:
- Headquarters: Anna Building, QTSC, Trung My Tay Ward
- Office 1: German House, 33 Le Duan, Saigon Ward
- Office 2: DIGI-TEXX Building, 477-479 An Duong Vuong, Binh Phu Ward
- Office 3: Innovation Solution Center, ISC Hau Giang, 198 19 Thang 8 street, Vi Tan Ward
References
- Gartner. (2021). How to Stop Data Quality Derailing Your Business. Gartner Research. https://www.gartner.com/smarterwithgartner/how-to-stop-data-quality-derailing-your-business
- ISO. (2022). ISO/IEC 27001 Information security management. International Organization for Standardization. https://www.iso.org/isoiec-27001-information-security.html